Companies
5 ways the new Looker dashboards make it easier to explore data


By Katie Gillespie & Elena Rowell
October 20, 2020 — Santa Cruz, CA
Two years ago, we decided to rebuild the dashboard experience in Looker to make it faster and more intuitive, and during JOIN 2019 we announced the beta version of these new dashboards. While Looker’s original dashboards were powerful, they lacked the fit-and-finish users were asking for. 11 months and over 1000 active customers later, these dashboards are ready for prime time and are now generally available to all. To mark this milestone, let’s take a look at some of the newest ways to explore data with Looker dashboards and dive deeper into some of the classic Looker dashboard characteristics that our customers have come to love over the years.
New functionalities to fuel more data-driven experiences
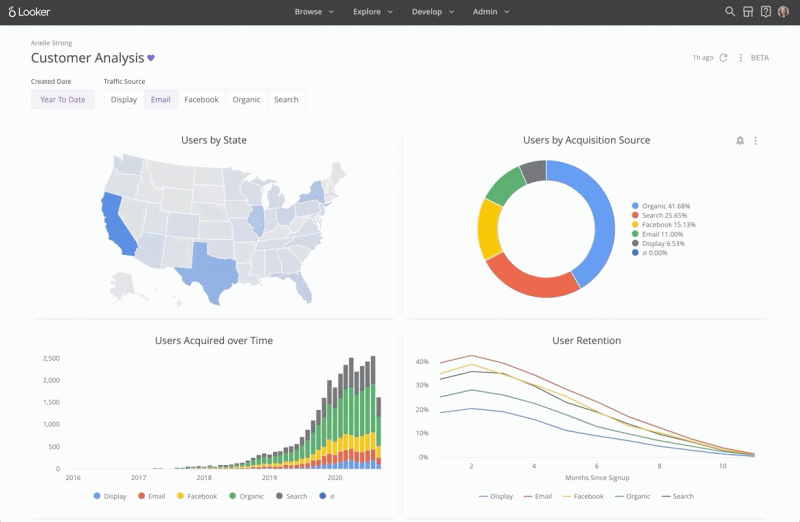
1) Filters galore
Much of the magic of dashboards is wrapped up in a users’ ability to manipulate the data, filtering it for their specific needs. Curate intuitive and powerful environments for them using one (or all) of the 12 types of filters. Making this level of granularity available to users better enables them to find what they need on their own and eliminates hours of ad-hoc requests for analysts.
Continue reading here: https://looker.com/blog/new-looker-dashboards
###
Tagged Looker