Companies
How do Santa Cruz and Monterey wages compare?


By Jim Johnson
The Compensation Depot
[Editor’s note: Santa Cruz Tech Beat published Jim Johnson’s How do Santa Cruz wages really compare to Silicon Valley? on September 11, 2014.]
WHY do Transit Bus Drivers in Santa Cruz make 28.7% more than the drivers in Monterey? WHY do Pharmacy Aides in Santa Cruz make 51.3% less than those in Monterey County? WHY do Tax Preparers in Santa Cruz make 45.9% less than those in Monterey County?
A second deep dive analysis: Santa Cruz County vs. Monterey County
After completing and publishing an analysis of Santa Cruz Wages vs. Silicon Valley Wages I was curious about how wages in Santa Cruz compare to our neighbors to the south, so I completed a similar analysis comparing Santa Cruz wages to wages in Monterey County. (Note: The hyperlinked article above provides a helpful context within which to view this article.)
Most people reading this analysis would assume that the wages in Santa Cruz are much closer to those of Monterey County than they are to Silicon Valley (-17.2% overall). They would be right! Here’s a high level summary of the primary findings from this analysis:
- Overall, the Santa Cruz County median annual wage is $42,645 vs. $43,367 for Monterey County, a difference of only -1.7%
- Santa Cruz median wages are compared for 22 high-level major occupational categories:
- Sixteen (16) of the major occupational categories lag the median wages in Monterey County. Thirteen (13) lag by less than 10%. Three (3) categories lag by over 10%. They are:
- Life, Physical and Social Science Occupations (-10.3%)
- Education, Training and Library Occupations (-25.6%)
- Building and Grounds Cleaning and Maintenance Occupations (-32.0%)
- Median Santa Cruz wages for 6 of the 22 major occupational categories exceed the medians for Monterey County:
- Construction and Extraction Occupations (+0.7%)
- Office and Administrative Support Occupations (+2.2%)
- Production Occupations (+3.1%)
- Transportation and Material Moving Occupations (+6.1%)
- Healthcare Support Occupations (+6.6%)
- Protective Service Occupations (+7.5%)
This analysis, like the prior wage comparison with Silicon Valley is based on data from the May 2013 National, State, Metropolitan, and Nonmetropolitan Area Occupational Employment and Wage estimates from the U.S. Bureau of Labor Statistics.
Pay data for 238 Santa Cruz job classifications (67,400 employees) were compared with pay for the same job classifications for the Salinas Standard Metropolitan Statistical Area (SMSA) with 123,140 employees in jobs matched to Santa Cruz job titles. (Note: The Salinas SMSA is made up of all jobs in Monterey County.)
In this analysis Santa Cruz is used interchangeably with Santa Cruz County. Also, the term “wages” is used interchangeably with “base pay and base salaries.”
High Level Summary Statistics
My analysis begins by providing a high level overview of the competitive landscape, looking at 22 major job functional/occupational categories into which 238 specific job classifications have been “rolled up”. These categories are based on the U.S. Bureau of Labor (BLS) Standard Occupational Classification (SOC) system covering the entire spectrum of Santa Cruz jobs.
These major categories are:
11 – Management Occupations
13 – Business and Financial Operations Occupations
15 – Computer and Mathematical Occupations
17 – Architecture and Engineering Occupations
19 – Life, Physical, and Social Science Occupations
21 – Community and Social Service Occupations
23 – Legal Occupations
25 – Education, Training, and Library Occupations
27 – Arts, Design, Entertainment, Sports, and Media Occupations
29 – Healthcare Practitioners and Technical Occupations
31 – Healthcare Support Occupations
33 – Protective Service Occupations
35 – Food Preparation and Serving Related Occupations
37 – Building and Grounds Cleaning and Maintenance Occupations
39 – Personal Care and Service Occupations
41 – Sales and Related Occupations
43 – Office and Administrative Support Occupations
45 – Farming, Fishing, and Forestry Occupations
47 – Construction and Extraction Occupations
49 – Installation, Maintenance, and Repair Occupations
51 – Production Occupations
53 – Transportation and Material Moving Occupations
A cautionary note: Reviewers should keep in mind that these are statistical “estimates” of wages that are based on data reported by employers in the counties involved. The data points are estimates; however, they are based upon quite possibly the most comprehensive wage database in existence, and provide a valid basis for attaining a general assessment of an area’s competitive landscape. This data should be treated as only one of several inputs in assessing the pay competitiveness of a specific enterprise.
Chart 1 shows how the major job categories for Santa Cruz County compare with Monterey County:
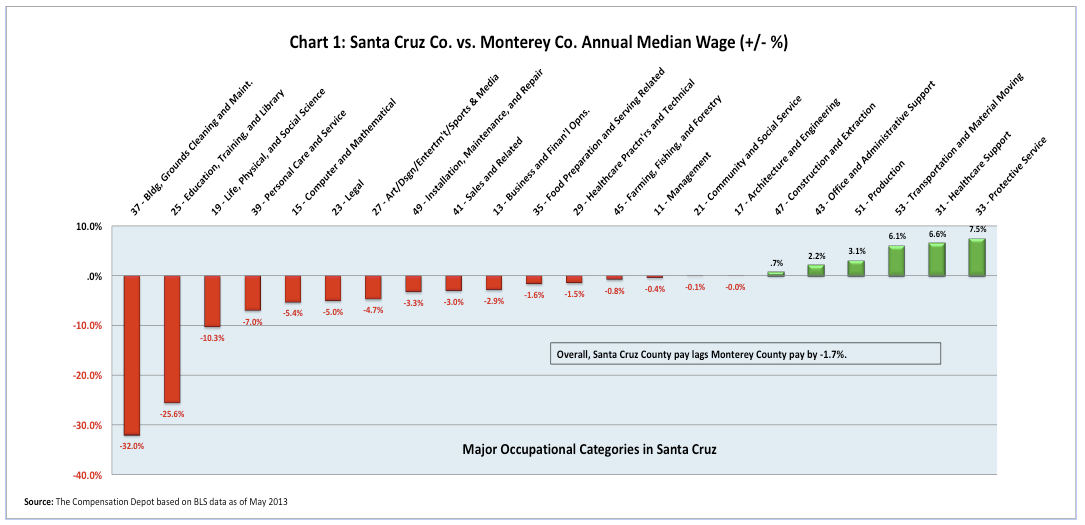
Chart 2 is included to graphically illustrate the median annual salaries for the major occupational categories (listed in the same order, from least to most competitive, as those shown in Chart 1). The (+/- %) differences in Chart 1 correlate to the variations in height between the blue and red bars for each occupational category depicted in the chart.
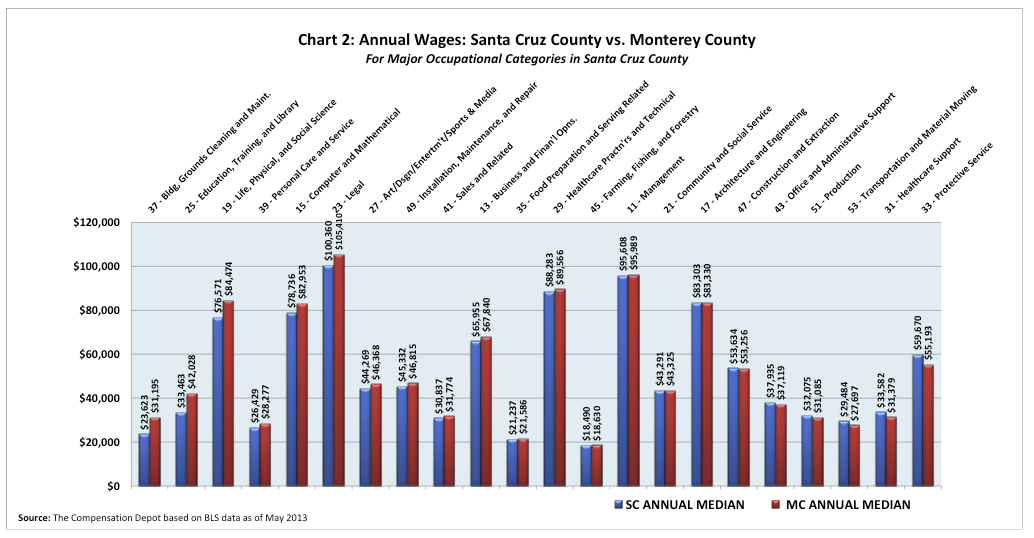 Refer to Charts 1 & 2: Santa Cruz median wages lag Monterey County in 15 of the 22 major (high level) occupational categories although 13 categories lag by less than 10% with 11 of those lagging less than 5%. In general, the wages between the two counties are close, indicating a relatively healthy balance in the competitive labor market. (Caution: These categories are very broad, containing jobs with a wide range of pay competitiveness. For example, the Building and Grounds Cleaning and Maintenance category (for Santa Cruz) includes five job titles ranging from 120 First-Line Supervisors of Housekeeping & Janitorial Workers (+6.8%) to 1,630 Janitors & Cleaners (-43.6%).
Perspective
Pay differences of the magnitude shown for the Building and Ground Cleaning and Maintenance category (-32%) and the Education, Training and Library category (-25.6%) generally indicate an imbalance in the number of qualified applicants available, and the potential number of available jobs within the occupational category. In other words, the traditional laws of “supply and demand” are generally the key drivers at work here. The following are likely to be contributing factors:
- Short supply – The supply of qualified applicants may exceed the number of available positions in Santa Cruz (applicants will accept lower wages just to get a job), and/or,
- Excess demand – The availability of these specific jobs in Monterey County may exceed the number of qualified applicants (employers must pay a premium wage just to fill the position)
It is interesting that the requirements (e.g., education and skill sets) for these job classifications are quite different, underlying the fact that possessing a particular level of education and skill doesn’t necessarily translate into the availability of a position in which one can be gainfully employed. Most of us still have painful memories of libraries closing and school districts handing out pink slips in the not too distant past. Obviously, there are other factors at work here also.
Difference in the Santa Cruz and Monterey County Databases
One of those factors may well be the differences in makeup of the employment sectors of the two counties. This study focuses only on the occupational categories and their underlying jobs in Santa Cruz County – jobs that also exist in Monterey County. However, Monterey County has a more diverse array of jobs (a somewhat different “competitive landscape”) than Santa Cruz County. Employers in Santa Cruz County reported employees in a total of 323 job classifications to the Bureau of Labor Statistics (BLS), whereas Monterey County reported employees in a total of 361 job classifications. 78 of Monterey County’s 361 job classifications were not reported to BLS by employers in Santa Cruz County. That represents 24.1% of Santa Cruz’s jobs, a significant difference. It’s conceivable that the availability of this number of “additional choices” could impact the “competitive balance” of some of the job classifications in the analysis.
The job titles of these 78 classifications suggest that many of them are associated with the Monterey Airport and the travel industry, as well as Monterey County’s significantly larger agriculture industry. [As a side note it’s interesting that all but 8 of Monterey’s job classifications are included in the database for the San Jose Standard Metropolitan Statistical Area or (SMSA)]. A complete list of these 78 jobs, with their median wages, sorted by occupational category is available along with other detail from this analysis under the “Downloads” tab at www.thecompensationdepot.com.
Delving into the Detail
Space constraints in this article preclude my inserting all the underlying analytical detail for each of the 22 major occupational categories highlighted above, so tabular details are included in this article for only three groupings of the above 22 major categories. I’ve included detailed comparisons for major occupational categories representing the “less”, “average” and “most” competitive categories from the charts above.
(To view the underlying detail for all 22 occupational categories and the underlying 238 jobs, download the Excel spreadsheet containing the information from the following website: www.thecompensationdepot.com. Reports are available under the “Downloads” tab.)
Table 1 focuses on the three overall “less competitive” categories.
The top category, Life, Physical and Social Science (-10.3% overall, with three underlying jobs) that range from +3.4% (Urban & Regional Planners, green oval) to -15.0% (Environmental Sciences & Specialists, Including Health, red oval).
The second category, Education, Training and Library (-25.6% overall, with 6 underlying classifications) has a wider dispersion of competitiveness ranging from +26.3% (Self-Enrichment Educ. Teachers, who apparently practice what they teach, green oval) to -56.4% (Substitute Teachers, red oval).
The third category, Building, Grounds Cleaning and Maintenance (-32% overall, with 5 jobs) has a competitive range of from +6.8% (First-Line Supvr. of Housekeeping & Janitorial Workers, green oval) to -43.6% (for the employees they supervise, Janitors & Cleaners, Except Maids & Housekeeping Cleaners, red oval).
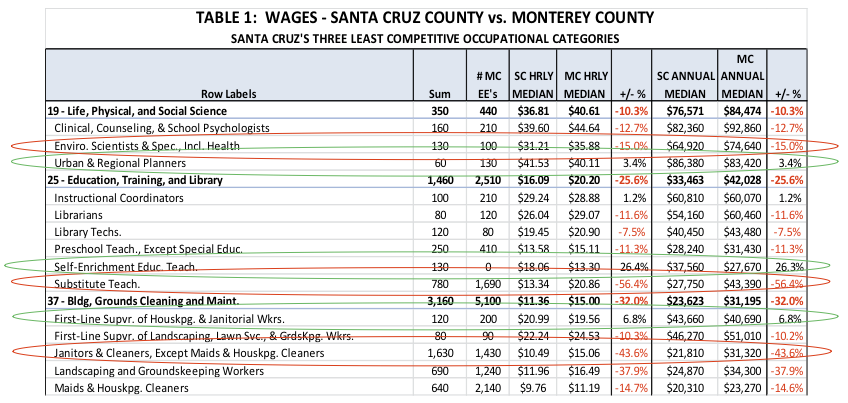 Table 2 is provided to focus on three occupational categories positioned “mid-range” in the Chart 1 competitive distribution. The top category, Business and Financial Operations (overall -2.9%), includes 17 job titles found throughout the diverse enterprises in Santa Cruz. The competitiveness of individual jobs ranges from The Management Analysts (+24.4%, green oval) to Tax Preparers (-45.9%, red oval).
The second category, Art/Design/Entertainment/Sports & Media (overall -4.7%) includes only 5 jobs ranging from Floral Designers (+19.2%, green oval) to Public Relations Specialists (-25.8%, red oval).
The last category, Healthcare Practitioners and Technical (overall -1.5%) includes 17 underlying job classifications. The competitiveness of those jobs ranges from a high for the Radiologic Technologists (+31.4%, green oval) to a low for Speech-Language Pathologists (-20%, red oval).
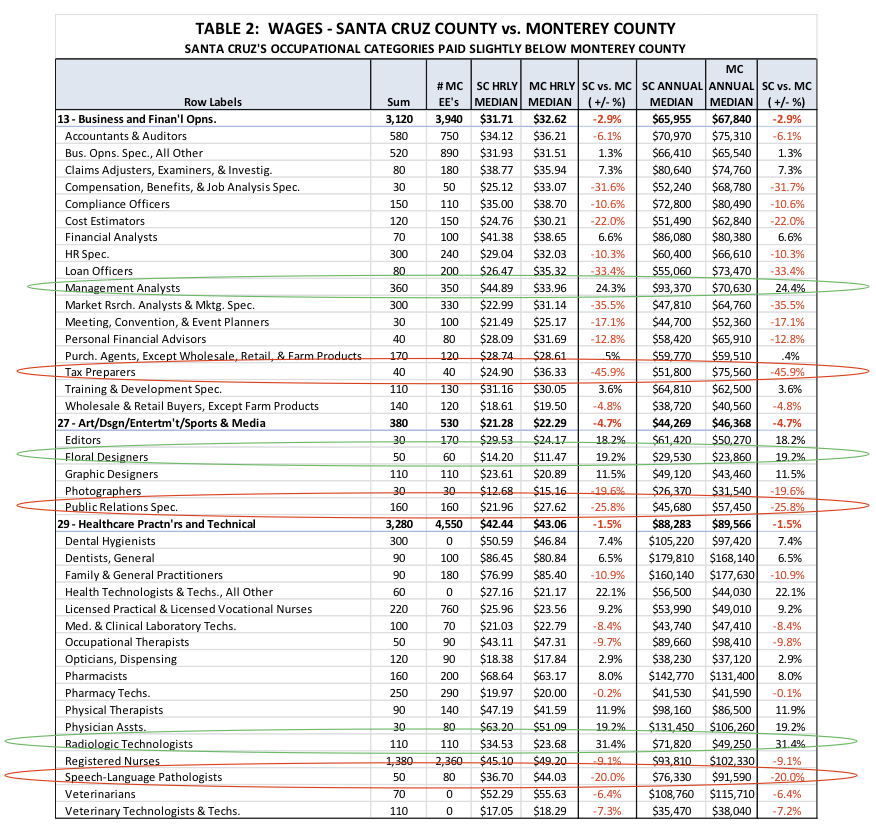
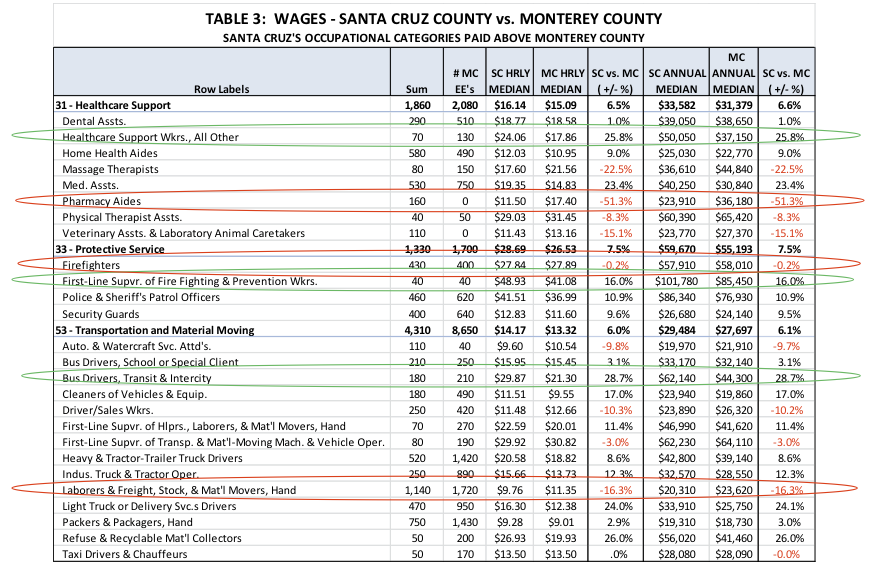
Table 3 provides detail on three of the six occupational categories where overall Santa Cruz wages are higher than those of Monterey County.
The first occupational category is Healthcare Support which leads by +6.6% overall. It includes 8 job classifications ranging in competitiveness from +25.8 for Healthcare Support Workers, All Others (green oval, to -51.3% for Pharmacy Aides (red oval).
The second occupational category is Protective Service which leads by +7.5% overall. It includes only 4 job classifications ranging in competitiveness from +16.0% for First-Line Supervisors of Fire Fighting & Prevention Workers (green oval),to -0.2% for Firefighters (red oval).
The third occupational category is Transportation and Material Moving which leads by +6.1% overall. It includes 14 job classifications, 9 of which have higher wages than Monterey. These jobs range in competitiveness from +28.7% for Bus Drivers, Transit & Intercity (green oval),to -16.3% for Laborers & Freight, Stock and Material Movers, Hand (red oval).
Detail General Observation and a Call to Action
In doing this analysis I was struck by the number of times the occupational category (Building, Grounds Cleaning and Maintenance) and the underlying job classifications (Landscaping, Lawn Service & Grounds-keeping Workers and their Supervisors) came to the surface. One of my objectives, as stated above, was to examine the “competitive landscape” of Santa Cruz and Monterey Counties. It occurred to me that we are the competitive landscape. As individual and collective wage earners we are the grass roots and the green shoots . . . the human capital that is paid to create and/or maintain all other forms of capital. This role is a unique privilege that carries with it the responsibility to conserve and preserve . . . responsibilities not dis-similar to those engaged in creating and preserving the beautiful landscapes of our counties.
One of my favorite quotes is by the novelist Henry Miller (1891-1980): “The moment one gives close attention to anything, even a blade of grass, it becomes a mysterious, awesome, indescribable magnificent world in itself.”
Our individual and collective responsibilities to conserve and preserve our competitive landscape, in both Santa Cruz and Monterey County should compel us to “give close attention” to our wages. The closer we look at pay, the more fascinating it becomes, especially when we start asking the WHY questions. For example, WHY do Transit Bus Drivers in Santa Cruz make 28.7% more than the drivers in Monterey? WHY do Pharmacy Aides in Santa Cruz make 51.3% less than those in Monterey County? WHY do Tax Preparers in Santa Cruz make 45.9% less than those in Monterey County? These questions will go on and on, and they’ll change over time, simply because we’re a part of a dynamic labor market and an ever changing competitive landscape. The WHY questions are always the most difficult. I won’t EVEN attempt to ask what’s FAIR! (Can you start to see the parallel with the “blade of grass” quote?)
The WHAT questions are usually much easier. Most of us don’t have the power or resources to fix a wage problem for the entire county, but many of us do have the power to influence the organization in which we work. For example, let’s say you suspect that you have jobs in your organization that are paid significantly below or above where they should be paid. WHAT can you do about it?
Fortunately, there are actions you can take. As a first step you might want to validate your suspicion by participating in a reputable salary survey to secure valid and reliable data against which you can assess how your jobs are paid relative to the specific labor market in which you compete. If you can’t measure it, you can’t control it! Once you know how your salaries compare you can develop a strategy, plan and budget to correct the problem over time, as your organization can afford it. Pay problems become increasingly more difficult to correct as an organization (even a county) grows. They also tend to be more difficult to correct during “good times” when employees’ expectations are lifted with the rising economic tide.
I invite your comments and questions.
For more information or to contact Jim Johnson:
- http://www.thecompensationdepot.com (full analysis is available under “Downloads” tab)
- jimdjohnson99@thecompensationdepot.com
###