Companies
Wages: Monterey County vs. Silicon Valley


By Jim Johnson
The Compensation Depot
[Editor’s note: Santa Cruz Tech Beat published Jim Johnson’s How do Santa Cruz wages really compare to Silicon Valley? on September 11, 2014, and How do Santa Cruz and Monterey wages compare? on September 25, 2014. This third article comparing wages in Monterey County and Silicon Valley completes the troika.]
During the month of September I completed and published two “deep dive” analyses: 1.) Santa Cruz Wages vs. Silicon Valley Wages and 2.) Santa Cruz Wages vs. Monterey County Wages. These analyses provided a high level overview of Santa Cruz wages relative to its bordering competitive labor markets. The studies did not provide a direct comparison of Monterey County’s wages to Silicon Valley, a comparison that I was interested in. That’s the primary purpose of this analysis. (Note: The two hyperlinked articles above provide a helpful backdrop against which to view this article.)
Because Santa Cruz wages are on average -17.2% below Silicon Valley and -1.7% below Monterey County, I assumed that Monterey County’s wages would fall slightly closer to Silicon Valley than those of Santa Cruz, an assumption that proved to be correct. Here’s a high level summary of the primary findings from this analysis:
- Overall, the Monterey County median annual wage from this analysis is $37,016 vs. $41,979 for Silicon Valley, a difference of -13.4%
- Monterey median wages are compared for 22 high-level major occupational categories:
- Twenty (20) of the major occupational categories lag the median wages in Silicon Valley. Ten (10) lag by less than 10%, ranging from -0.4% to -7.8%. Ten (10) categories lag by over 10%, ranging from ‑11.7% to -74.8%.
- Median Monterey wages for two (2) of the 22 major occupational categories exceed the medians for Silicon Valley. They are:
- Life, Physical and Social Sciences (+2.6%)
- Building, Grounds Cleaning and Maintenance (+10.6%)
This analysis, like the two prior wage comparisons for Santa Cruz County, is based on data from the May 2013 National, State, Metropolitan, and Nonmetropolitan Area Occupational Employment and Wage estimates from the U.S. Bureau of Labor Statistics.
Pay data for 300 Monterey job classifications (134,510 employees) were compared with pay for the same job classifications for the San Jose Standard Metropolitan Statistical Area (SMSA) with 729,910 employees in jobs matched to Monterey County job titles. (Note: The Salinas SMSA is made up of all jobs in Monterey County.)
In this analysis Monterey is used interchangeably with Monterey County. Silicon Valley is used interchangeably with Santa Clara County. Also, the term “wages” is used interchangeably with “base pay and base salaries”.
High Level Summary Statistics
My analysis begins by providing a high level overview of the competitive landscape, looking at 22 major job functional/occupational categories into which 300 specific job classifications have been “rolled up”. These categories are based on the U.S. Bureau of Labor (BLS) Standard Occupational Classification (SOC) system covering the entire spectrum of Monterey County jobs. These major categories are:
11 – Management Occupations
13 – Business and Financial Operations Occupations
15 – Computer and Mathematical Occupations
17 – Architecture and Engineering Occupations
19 – Life, Physical, and Social Science Occupations
21 – Community and Social Service Occupations
23 – Legal Occupations
25 – Education, Training, and Library Occupations
27 – Arts, Design, Entertainment, Sports, and Media Occupations
29 – Healthcare Practitioners and Technical Occupations
31 – Healthcare Support Occupations
33 – Protective Service Occupations
35 – Food Preparation and Serving Related Occupations
37 – Building and Grounds Cleaning and Maintenance Occupations
39 – Personal Care and Service Occupations
41 – Sales and Related Occupations
43 – Office and Administrative Support Occupations
45 – Farming, Fishing, and Forestry Occupations
47 – Construction and Extraction Occupations
49 – Installation, Maintenance, and Repair Occupations
51 – Production Occupations
53 – Transportation and Material Moving Occupations
A cautionary note: Reviewers should keep in mind that these are statistical “estimates” of wages that are based on data reported by employers in the counties involved. The data points are estimates; however, they are based upon quite possibly the most comprehensive wage database in existence, and provide a valid basis for attaining a general assessment of an area’s competitive landscape. This data should be treated as only one of several inputs in assessing the pay competitiveness of a specific enterprise.
Chart 1 shows how the major job categories for Monterey County compare with Silicon Valley:
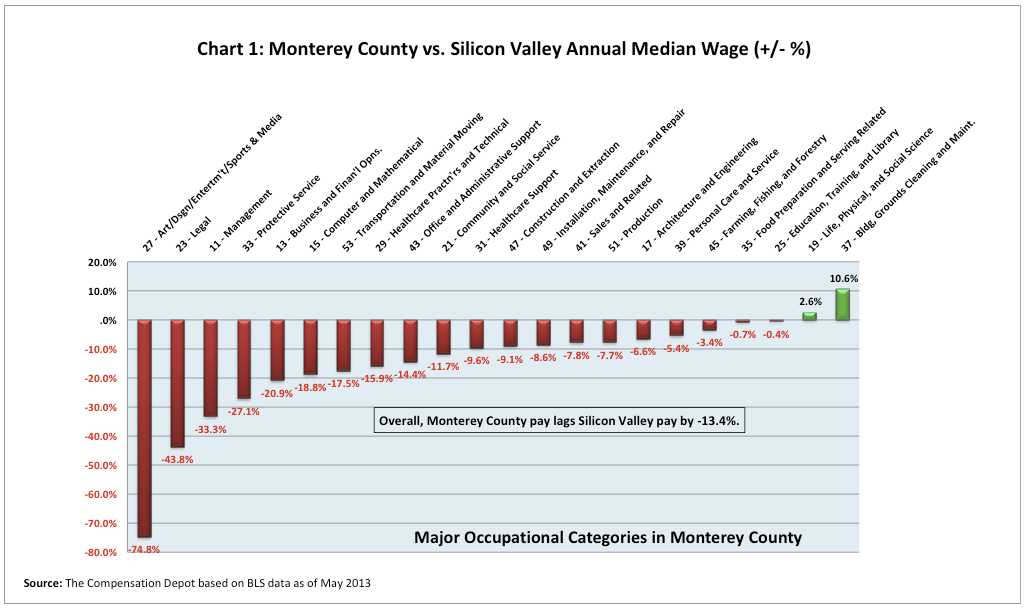 Chart 2 is included to graphically illustrate the median annual salaries for the major occupational categories (listed in the same order, from least to most competitive, as those shown in Chart 1). The (+/- %) differences in Chart 1 correlate to the variations in height between the blue and red bars for each occupational category depicted in the chart.
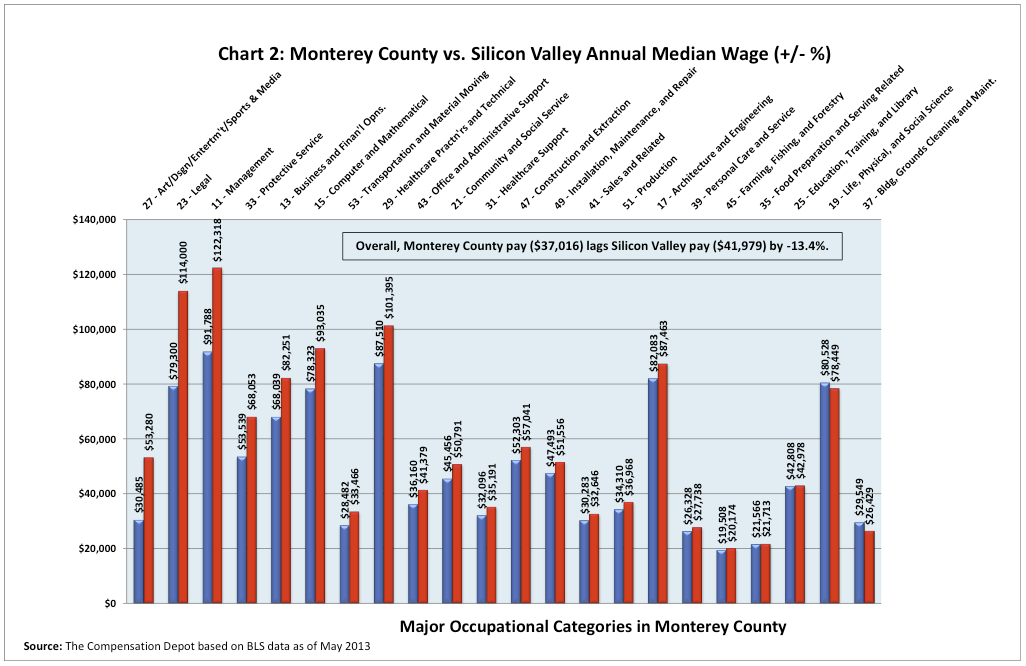
Refer to Charts 1 & 2: Monterey median wages lag Silicon Valley in 20 of the 22 major (high level) occupational categories with 10 categories lagging by more than 10% and 10 categories lagging by less than 10%. Only 2 occupational classifications pay more than Silicon Valley (+2.6% & +10.6%). (Caution: These categories are very broad, containing jobs with a wide range of pay competitiveness. For example, the Management category (for Monterey County) includes 21 job titles with competitiveness ranging from 60 Education Administrators, All Others (+23.3%) to 290 Sales Managers (-83.6%).
Perspective
Pay differences of the magnitude shown for the Art/Design/Entertainment/Sports and Media occupational category (-74.8%) generally indicate an imbalance in the number of qualified applicants available, and the potential number of available jobs within the occupational category. (Starving Artists?) In other words, the traditional laws of “supply and demand” are generally key drivers at work here. The following are likely to be contributing factors:
- Short supply – The supply of qualified applicants may exceed the number of available positions in Monterey County (applicants will accept lower wages just to get a job), and/or,
- Excess demand – The availability of these specific jobs in Silicon Valley may exceed the number of qualified applicants (employers must pay a premium wage just to fill the position)
A Word About the Monterey County and Silicon Valley Databases
This study focuses only on the major occupational categories and their 300 underlying jobs in Monterey County – jobs that also exist in Santa Clara County. Monterey County employers reported employees in a total of 384 job classifications to the Bureau of Labor Statistics (BLS), whereas Santa Clara County reported employees in a total of 497 job classifications. Only two (2) of Monterey County’s 384 job classifications were not reported to BLS by employers in Silicon Valley (which includes Santa Clara & San Benito Counties) indicating a huge diversity of jobs, a diversity with large sample sizes that adds validity to this analysis.
Delving into the Detail
Space constraints in this article preclude my inserting all the underlying analytical detail for each of the 22 major occupational categories highlighted above, so tabular details are included in this article for only three groupings of the above 22 major categories. I’ve included detailed comparisons for major occupational categories representing the “less”, “average” and “most” competitive categories from the charts above. (To view the underlying detail for all 22 occupational categories and the underlying 238 jobs, download the Excel spreadsheet containing the information from the following website: www.thecompensationdepot.com. Reports are available under the “Downloads” tab.)
Table 1 focuses on the three overall “less competitive” categories.
The top category, Management (-33.3% overall, with 11 underlying jobs) ranging in competitiveness from +23.3% (Education Administrators, All Other, green oval) to -83.6% (Sales Managers, red oval).
The second category, Legal (-43.8% overall) has only one (1) underlying classification reported with a competitiveness level of -1.9% (Paralegals and Legal Assistants, red oval). (Note: The overall legal occupational category includes lawyers and other classifications not listed individually.)
The third category, Art/Design/Entertainment/Sports & Media (-74.8% overall, with 10 job classifications) has a competitive range of from +18.9% (Audio & Video Equipment Technicians, green oval) to -193.4% (Interpreters & Translators, red oval).
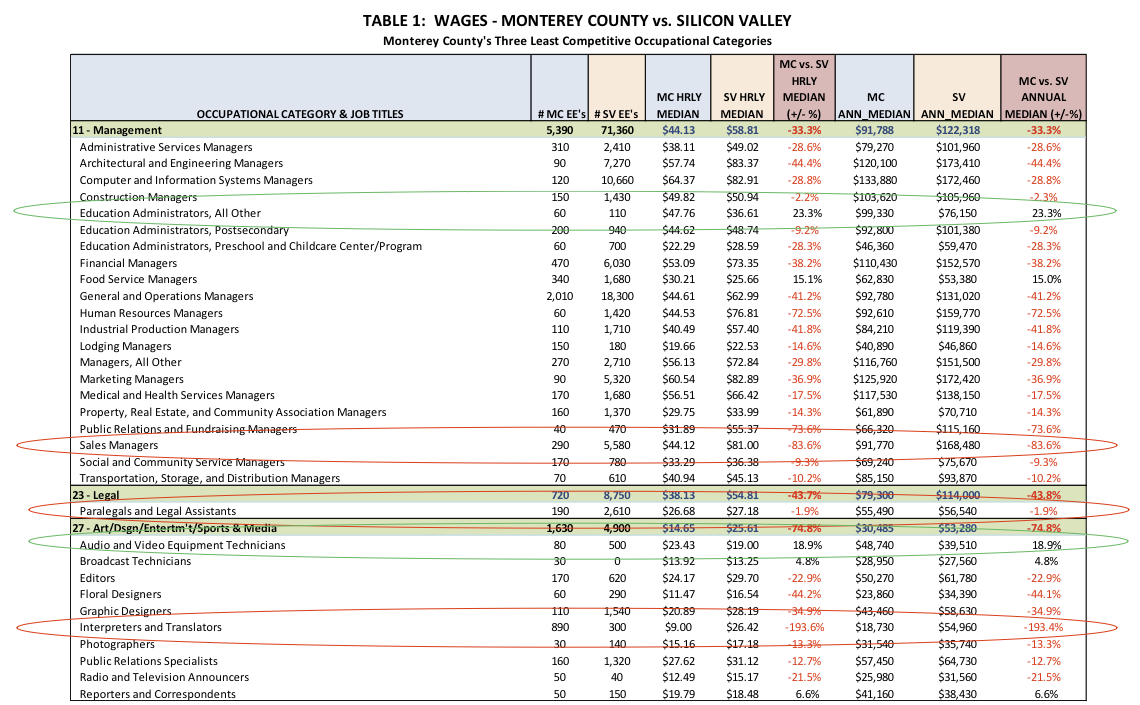
Table 2 is provided to focus on three occupational categories positioned “mid-range” in the Chart 1 competitive distribution. The top category, Healthcare Support (overall -9.6%), includes 10 job titles ranging in competitiveness from Massage Therapists (+44.8%, green oval) to Physical Therapist Aides (-26.3%, red oval).
The second category, Construction and Extraction (overall -9.1%) includes 14 jobs ranging from Hazardous Materials Removal Workers (+29.4%, green oval) to Helpers-Painters, Paperhangers, Plasterers and Stucco Masons (‑48.7%, red oval).
The last category, Installation, Maintenance & Repair (overall -8.6%) includes 16 underlying job classifications ranging in competitiveness from Farm Equipment Mechanics and Service Technicians (+9.4%, green oval) to Helpers-Installation, Maintenance and Repair Workers (-41.7%, red oval).
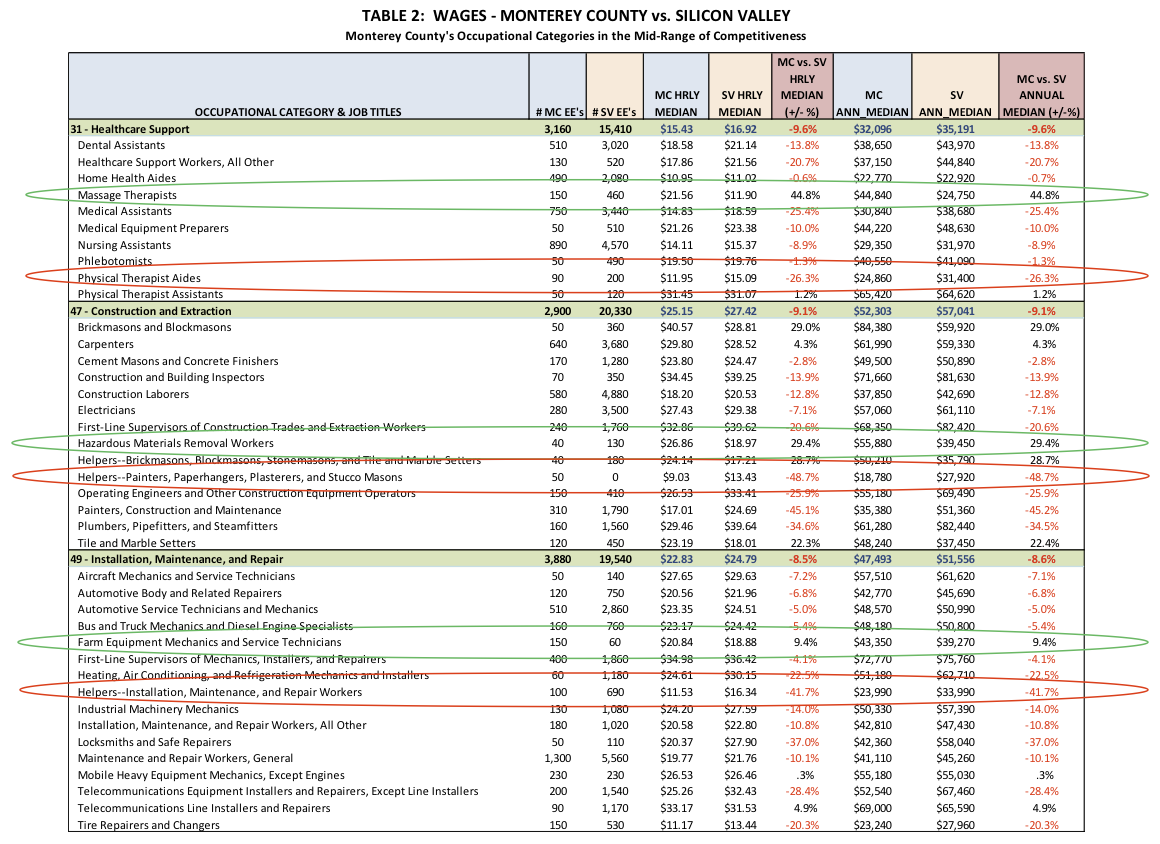
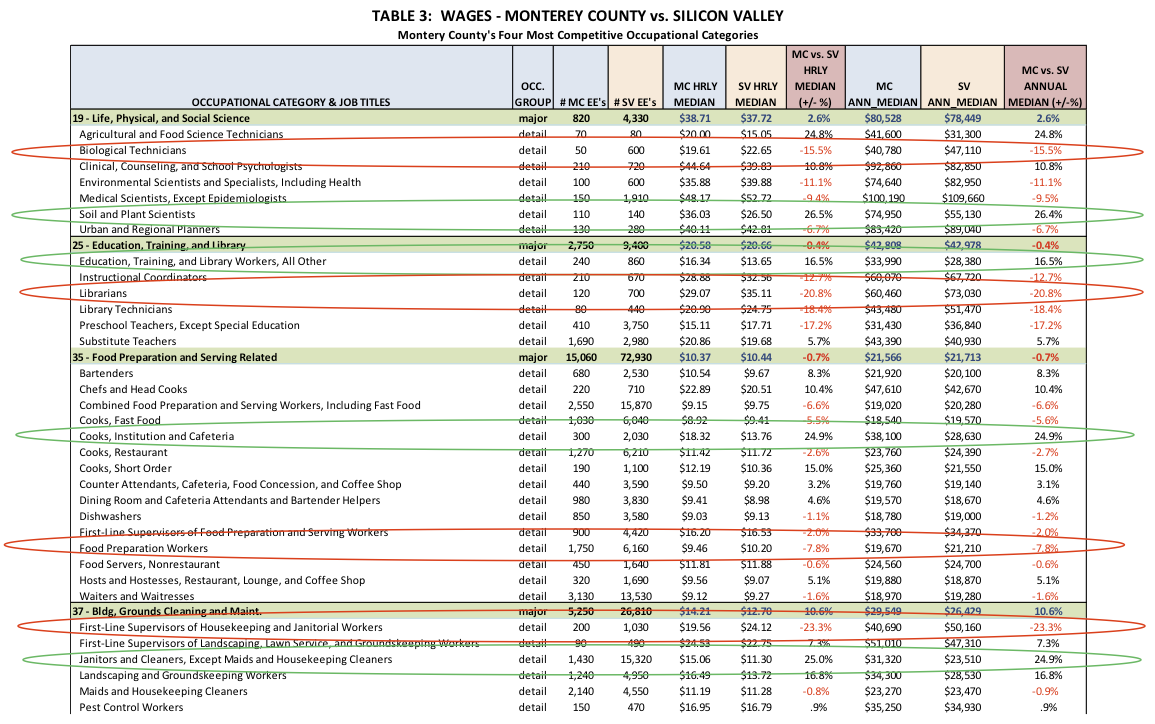
Table 3 provides detail on four of the six occupational categories where overall Monterey County wages are most competitive with those of Silicon Valley.
The first occupational category is Life, Physical and Social Science which leads by +2.6% overall. It includes 7 job classifications ranging in competitiveness from +26.4 for Soil and Plant Scientists (green oval), to -15.5% for Biological Technicians (red oval).
The second occupational category is Education, Training and Library which lags by +0.4%% overall. It includes 6 job classifications ranging in competitiveness from +16.5% for Education, Training and Library Workers, All Other (green oval), to -20.8% for Librarians (red oval).
The third occupational category is Food Preparation and Serving Related which lags by +0.7% overall. It includes 15 job classifications, 7 of which have higher wages than Silicon Valley. These jobs range in competitiveness from +24.9% for Cooks, Institution and Cafeteria (green oval), to -7.8% for Food Preparation Workers (red oval).
The fourth occupational category is Building, Grounds Cleaning and Maintenance which leads by +10.6% overall. It includes 6 job classifications, 4 of which have higher wages than Silicon Valley. These jobs range in competitiveness from +24.9% for Janitors and Cleaners, Except Maids and Housekeeping Cleaners (green oval), to -23.3% for First-Line Supervisors of Housekeeping and Janitorial Workers (red oval).
General Observations

Old Veteran Tree at Point Lobos (photo credit, Marty Cohen)
It is much like a Geico commercial to say that Monterey County is one of the most beautiful places on earth. Everyone knows that! The tourist, with camera in hand, capturing the beauty of its landscapes is a very familiar sight. These snapshots capture the scene as it exists at the time the shutter is released, yet, even natural landscapes change over time. One can only imagine how this image of “The Old Veteran” at Point Lobos has changed over the last 1,000 years.
This analysis provides a “snapshot” of Monterey’s wage landscape as it existed in May of 2013. This landscape, also changes over time… like the Monterey Cypress, it is shaped and re-shaped/pruned by the winds of economic change.
So, What Can We Do With This Snapshot?
We have a choice. We can place it in the archives, filed away in a dark room to collect dust. Or, we can take an active role in the “shaping and pruning” process. My hope is that we choose the latter. We do this by influencing the “winds of economic” change as best we can, even if it’s observing a snapshot and asking WHY wage extremes exist. Is there a justifiable reason why some employees are paid twice what others doing the same job are paid? Maybe it’s because they are twice as productive and we may decide that’s okay. But, maybe it’s because they’ve continued to receive a hefty wage increase every year for many years with no corresponding increase in results.
A fruit tree that receives too much water is apt to grow branches that are too long and too heavy (and produce less fruit). The wise caretaker will divert the water supply to other trees that are receiving too little water.
The wise manager will recognize that this same phenomenon probably exists in his/her organization. Maybe it’s time to take a closer look at the snapshot and do a more focused wage study on your organization and, if appropriate, consider some interventions in the water/wage flow process.
It is my sincere hope that this analysis will provide its reviewers with clearer insights relative to wages in Monterey County, not just versus Silicon Valley, but within Monterey County itself. It is also my hope that many reviewers will be stimulated by these insights to take a serious look into the pay practices of their own organizations asking themselves what they might be able to do to improve pay administration. The following questions might be a good place to start:
What are we paying for?
Successful organizations have a pay philosophy that is owned by executive leadership and clearly articulates WHAT the organization intends to pay for. Based on the pay philosophy, managers know WHAT behaviors to reward and employees see the link between their pay and the results they deliver.
How do we pay to attract, retain and motivate the talent we need to achieve the organization’s goals and objectives?
Successful organizations have a stellar pay strategy. The pay strategy supports the pay philosophy. It clearly defines what “competitive” means by naming the specific organizations with which it competes, and states the level at which it intends to compete (e.g., median, 60th percentile, etc.). An effective pay strategy is owned by executive management and empowers the management team at all levels . . . ensuring it has the ability to attract, retain and motivate employees to meet the organization’s goals and objectives.
Successful organizations provide the management team and their employees with the tools they need to effectively manage and understand the pay programs, systems and administrative processes. These tools include, but aren’t limited to: program communications, supporting documentation, administrative procedures and effective training, geared to the differing needs of management and employees.
Enough said. What do you think?
I invite your comments and questions.
For more information or to contact Jim Johnson:
- http://www.thecompensationdepot.com (full analysis is available under “Downloads” tab)
- jimdjohnson99@thecompensationdepot.com
###
Tagged Wages